

Performance Monitoring with Lighthouse and Gitlab Part 1

This is part one of a series of articles on monitoring website performance with Lighthouse. The goal of this first post is to just get the bare minimum up and running, it’s aimed more for those that don’t have much experience with Lighthouse, Gitlab, etc. The Lighthouse tool offers a lot of functionality, for more in-depth details please checkout their docs here and here. Also worth mentioning, Gitlab does provide a baked in solution for this, but you have to be on a paid tier of their service to use it. While the following will provide a completely free solution, there are some caveats, but we’ll get to that later.
Add lighthouserc.js file
To start with, you’ll need to add a lighthouserc.js file to the base directory of your project. For my minimal setup, it looks like this:
module.exports = {
  ci: {
    collect: {
      url: ['https://www.frustratedrobot.com'],
      settings: {chromeFlags: '--no-sandbox'},
    },
    upload: {
      target: 'temporary-public-storage',
    },
    assert: {
      assertions: {
        "categories:performance": ["error", {"minScore": .8}],
        "categories:accessibility": ["error", {"minScore": .9}],
        "categories:best-practices": ["error", {"minScore": 1}],
        "categories:seo": ["error", {"minScore": 1}],
        "categories:pwa": ["error", {"minScore": 1}],
        "uses-optimized-images": ["error", {"minScore": 1}],
        "uses-responsive-images": ["error", {"maxLength": 0}]
      }
    }
  }
};
- url: The page are you testing. In my case, I am testing after I deploy, so I am directing it to the actual deployed site. Ideally you’d want to test prior to deployments to catch issues before they go live, and I’ll get to that in the next post, but for now we are testing against the live site.
- settings:
{chromeFlags: '--no-sandbox'}is needed, just know that there are some security concerns to take into account when using it. More info here. - target: This is one of the caveats. When you set this to
temporary-public-storage, the test results are going to end up on a public server, something that everyone can see. If you are testing a personal project, this is probably no big deal, but just know that the test results accessible to anyone. Read here for more details. Lighthouse does provide a way for you to host these results yourself, again this is something that I’ll cover in a future post. - assertions: This is used to configure what you want to test on your page. There are many different options and settings that you can use and mine is pretty minimal. Again, check the docs for more information.
Add stage in .gitlab-ci.yml
In order to get this running in your gitlab pipeline, you’ll need to add a stage in the .gitlab-ci.yml file. For example, mine looks like this:
stages:
  - build
  - deploy
  - lighthouse

...
...
...

lighthouse:
  stage: lighthouse
  image: cypress/browsers:node14.15.0-chrome86-ff82
  script:
    - npm install -g @lhci/[email protected]
    - lhci autorun || exit 1
  only:
    - master
Most of this setup is taken directly from Lighthouse documentation, but there is one thing worth mentioning regarding gitlab.
- exit 1: If you want the stage to fail when a Lighthouse assertion fails, you need this included in your script. This will become more important in the future when testing pages prior to deployment because it enables you to use the stage as a gate to block poor performing code from being deployed. If you do not include
exit 1as it is above, the stage will pass no matter what, even if the lighthouse assertions fail.
Testing
That’s all there is to it for a minimal setup, you are now ready to test your page. Once the stage runs, open the logs for the job, they should look similar to below.
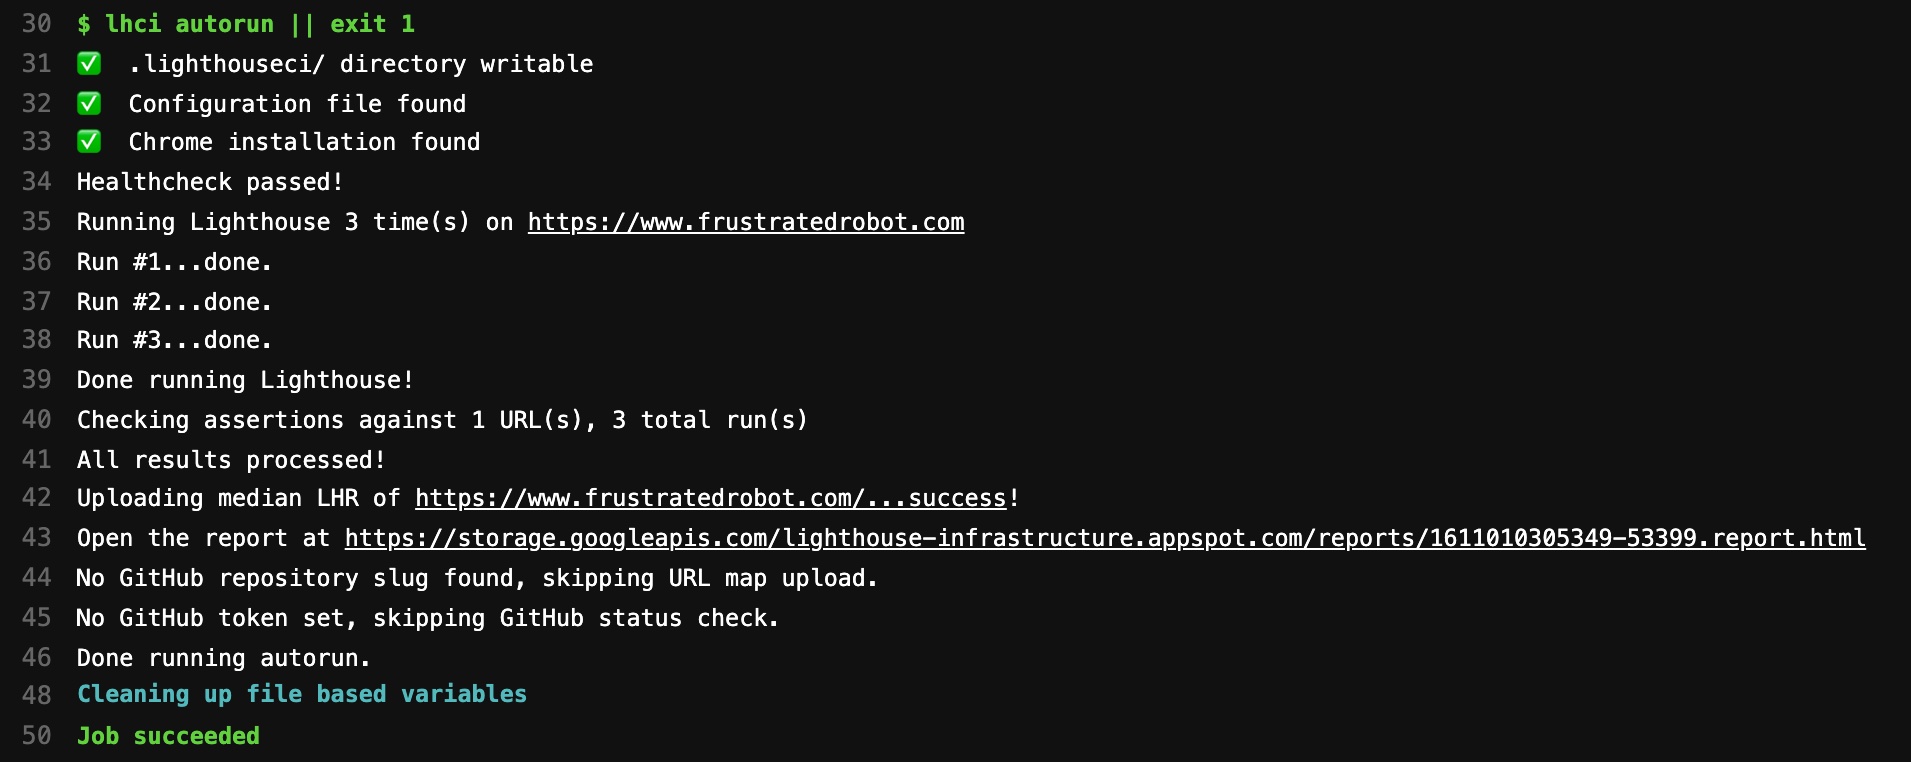
- The URL on line 43 is the link to the Lighthouse report.
- This example shows all passing assertions. Had there been failures, they would have been displayed in the logs as well.
Next
Two more up coming posts on this topic
- Using Lighthouse to test static sites prior to deployment
- Hosting your own LHCI server on AWS